02 · Build
For the
Love of Math
Interactive apps and explorations — built with Claude, JavaScript, and an obsession with making things work beautifully.
Regression Explorer
Interactive visualization of Linear vs Logistic Regression
An interactive regression tutorial covering Linear, Logistic, and Lasso regression with live visualizations. Perfect for data science interview prep, teaching ML fundamentals, or understanding when to use regularization. Built with Claude Sonnet 4.5 in a single conversation.
Open interactive app →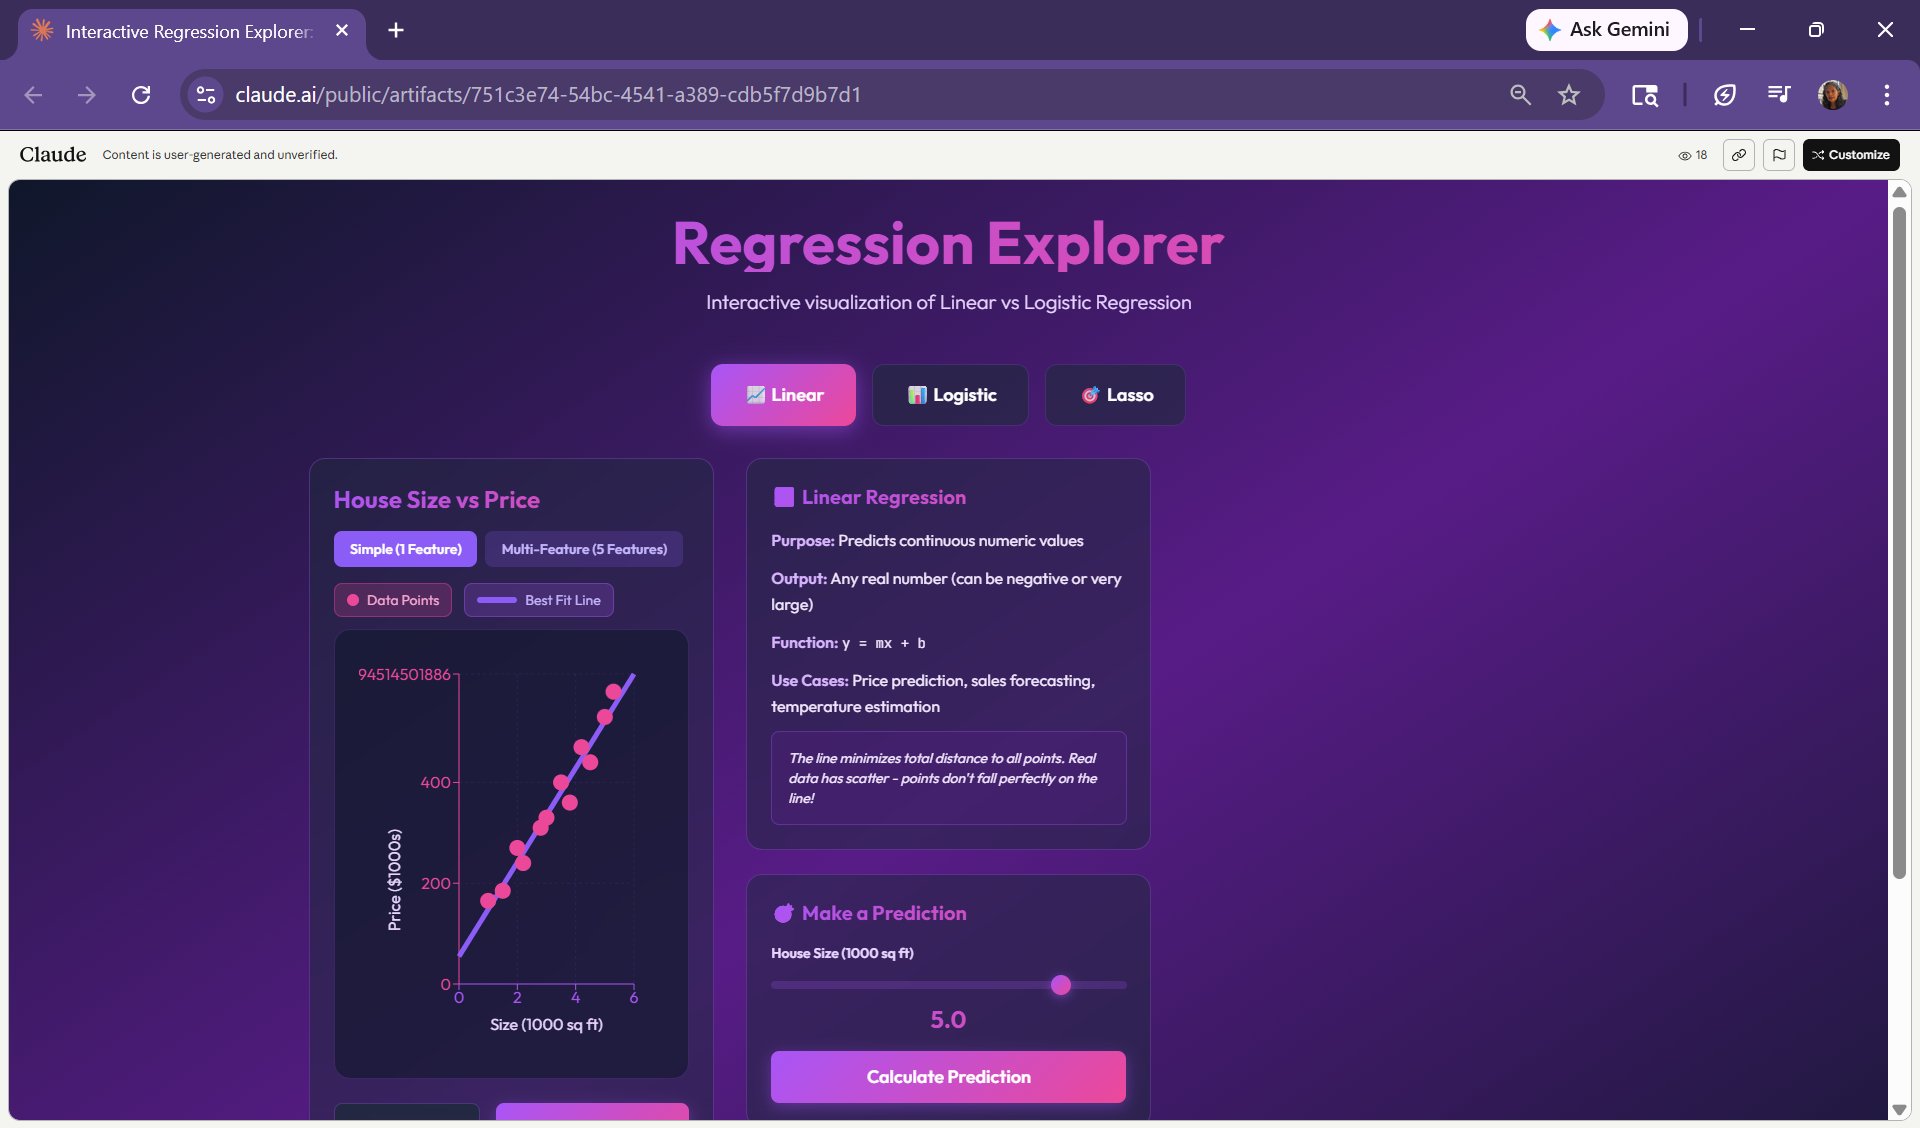
Lorenz Attractors
A Beautiful Journey into Chaos Theory
For the mathematically inclined, or the merely curious. An interactive 3D visualization of the Lorenz system — the butterfly effect, strange attractors, and deterministic chaos, live in your browser. Adjust σ, ρ, and β in real time and watch order dissolve into beautiful unpredictability.
Open interactive app →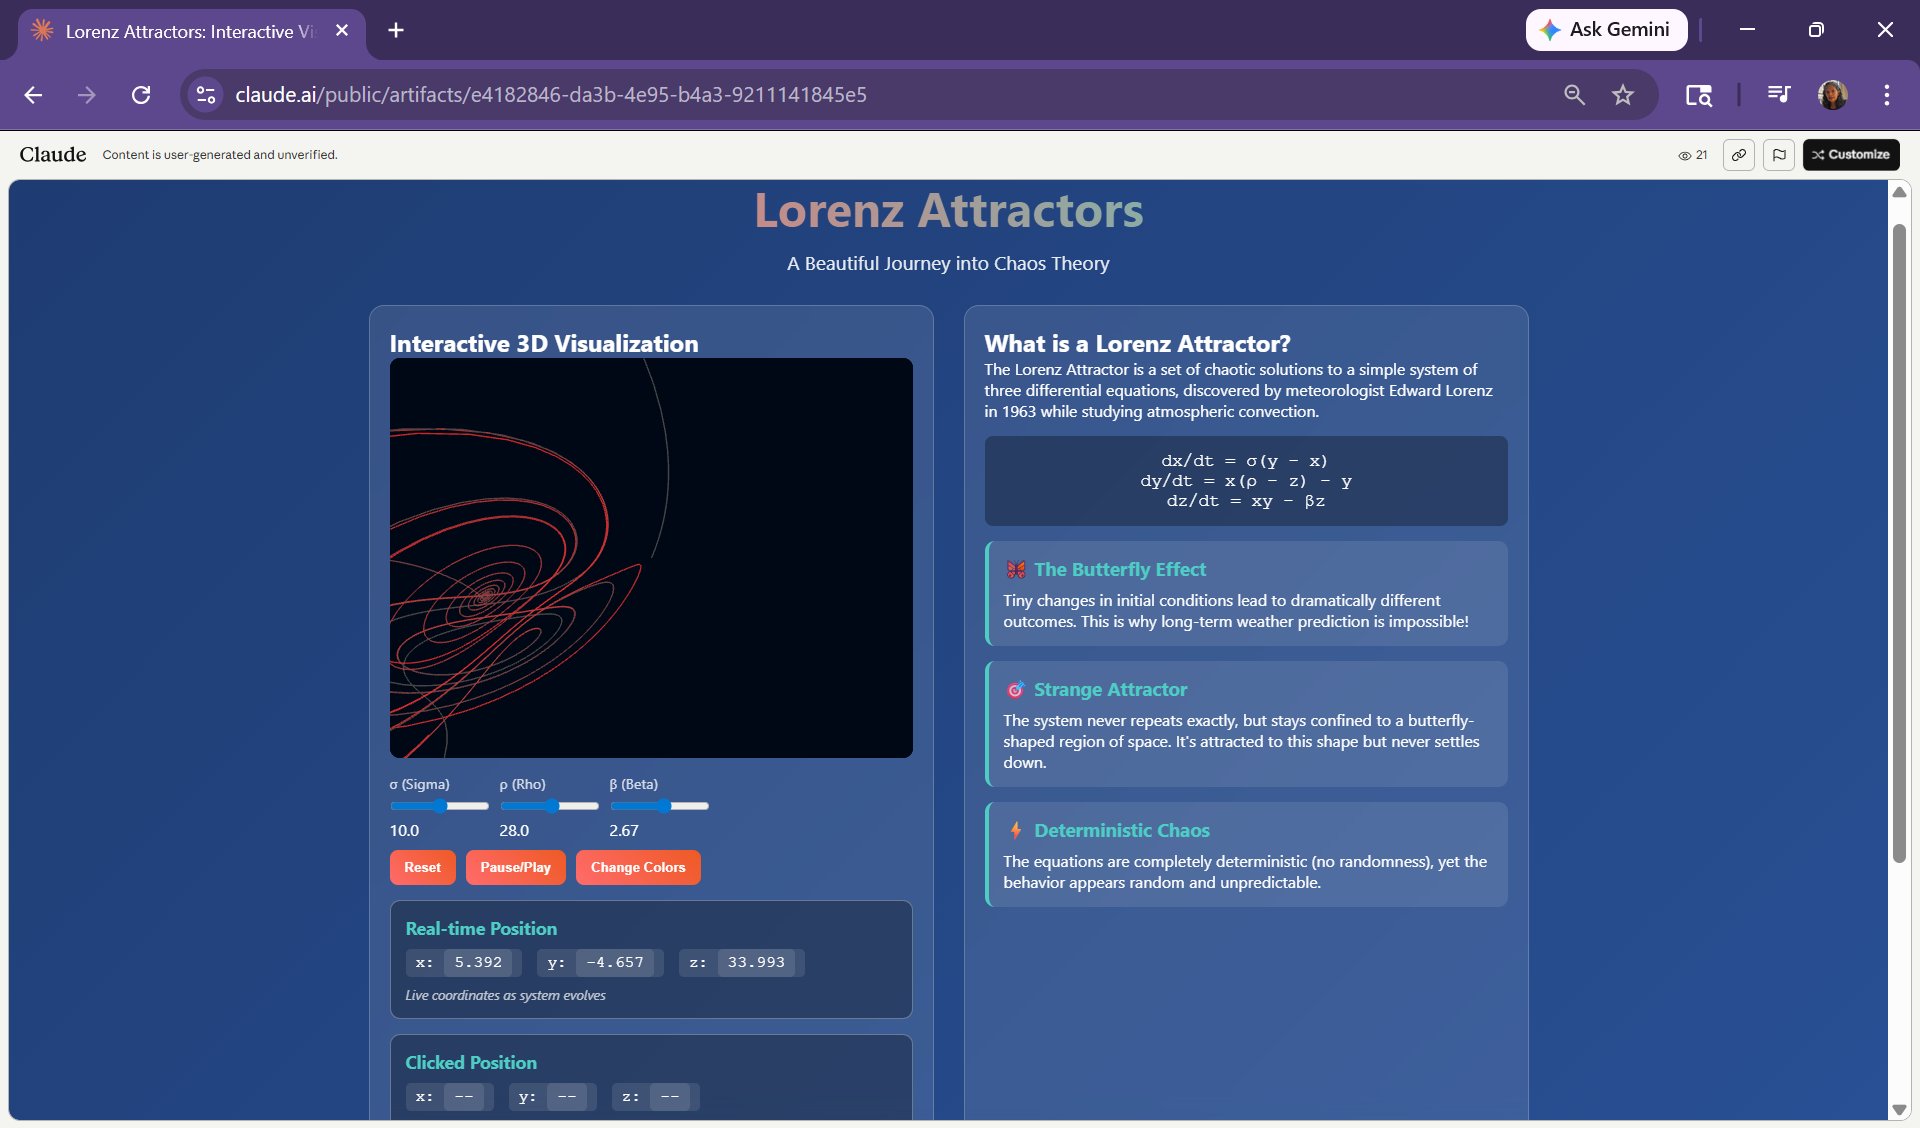
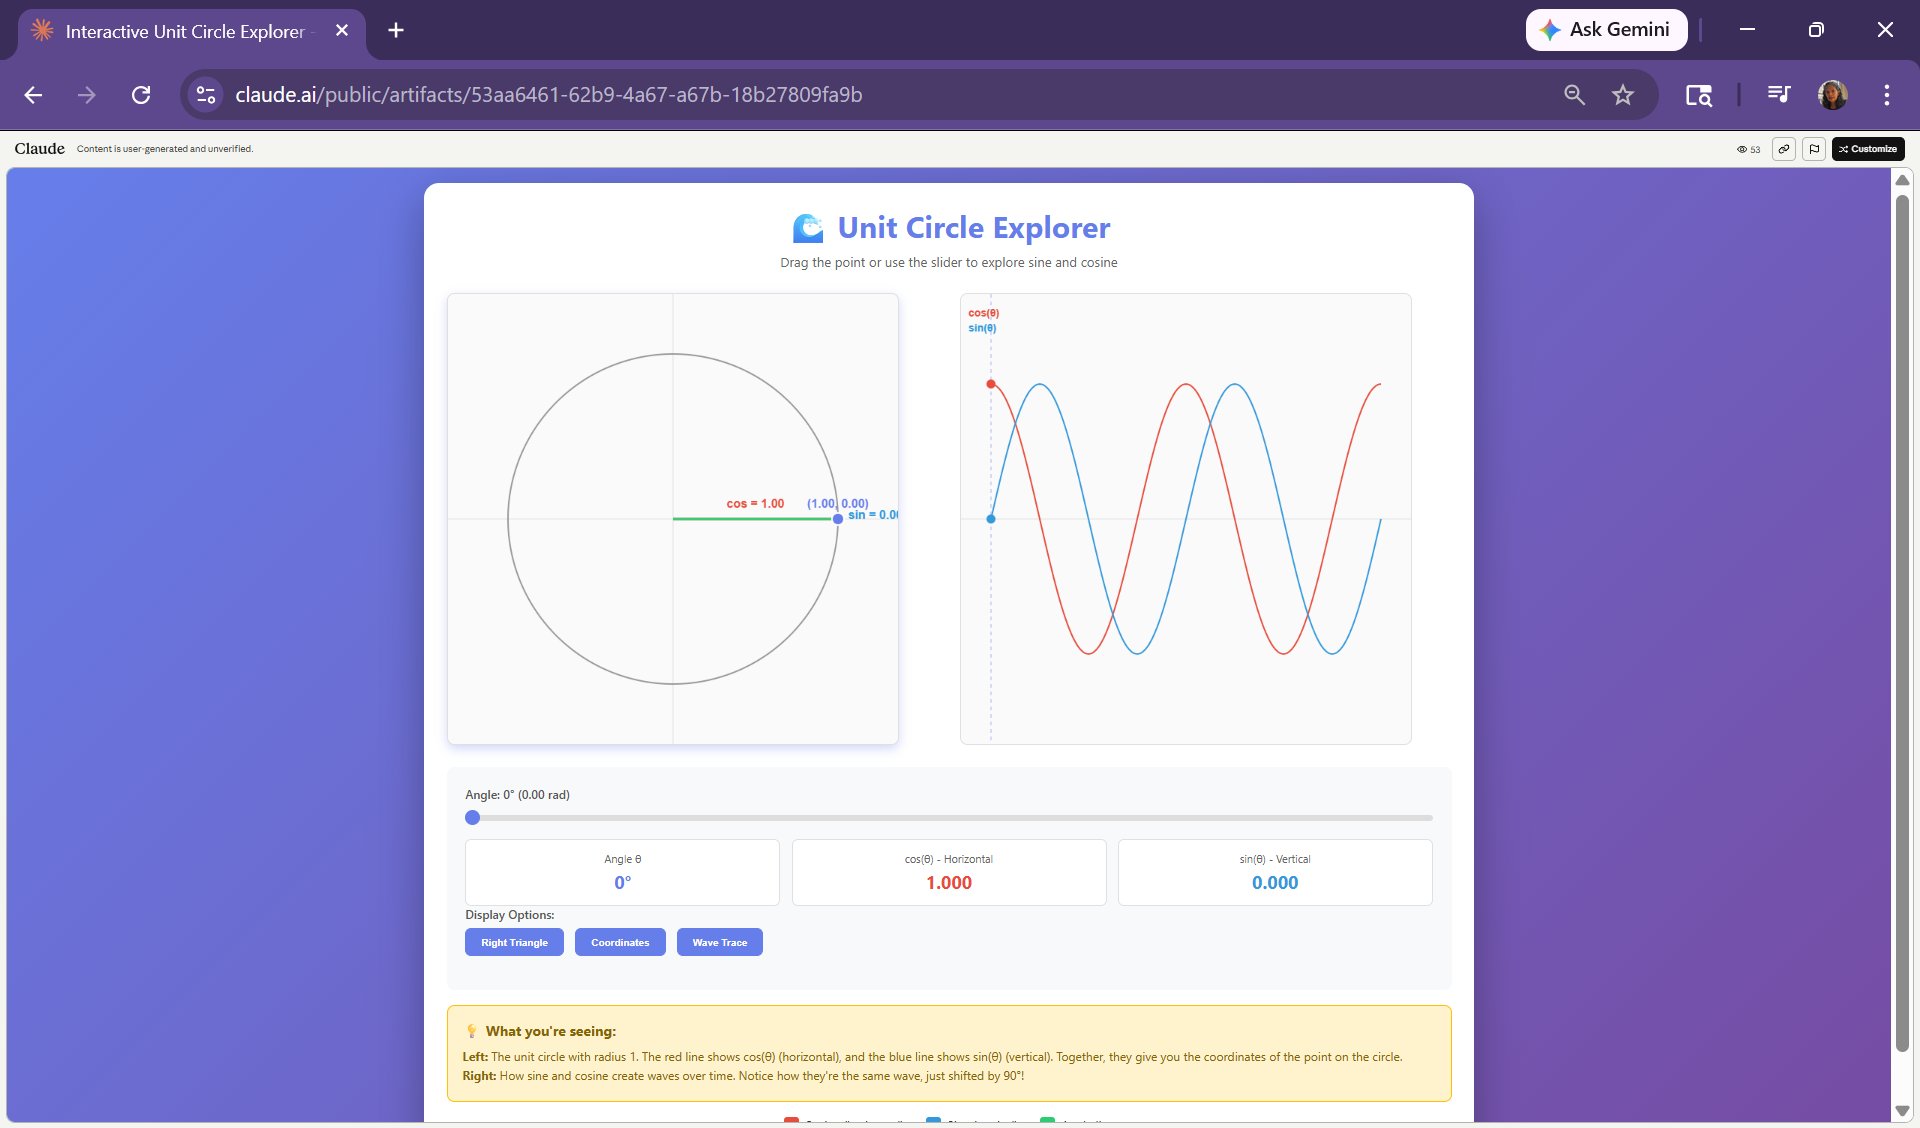
Unit Circle Explorer
Back to the basics
Drag the point or use the slider to explore sine and cosine. The unit circle on the left, the wave forms on the right — watch how they connect in real time. Sometimes the most powerful thing you can do is go back to fundamentals.
Open interactive app →